Slow disks are one of the most common yet frustrating bottlenecks in any server environment. Before you blame hardware failure or call your hosting provider, a few essential Linux tools can help you pinpoint exactly where the I/O pain is coming from. Here's a practical guide every sysadmin should have in their toolbox.
🔍 Start with `iostat` — Your I/O Snapshot
The `iostat` command gives you a bird's-eye view of disk performance. Run it with the `-x` flag for extended statistics:
```bash
iostat -x 1 5
```
Focus on three columns: `rawait` and `wawait` (I/O request service time in milliseconds) and `%util` (percentage of time the device was busy). A `%util` consistently above 80% with high await times suggests the disk is saturated and needs attention.
📊 Deep Dive with `iotop` — Find the Culprit
While `iostat` tells you what is slow, `iotop` reveals who is causing it. Run as root to see per-process read/write rates:
```bash
sudo iotop -oPa
```
The `-o` flag shows only processes actively doing I/O, `-P` shows processes instead of threads, and `-a` accumulates I/O statistics. This is invaluable when you spot a mystery process chewing through disk bandwidth during peak hours.
🧪 Stress Test with `ioping` — Measure Real Latency
Don't guess about latency — measure it directly. The `ioping` tool works like `ping` but for your storage subsystem:
```bash
ioping -c 10 /var/lib/mysql
```
For databases and virtual machines, anything below 1ms is excellent. Latency creeping above 5ms under load is a red flag. For deeper diagnostics, try random seeks across the device:
```bash
ioping -R /dev/sda
```
✅ Quick Wins to Reduce I/O Pressure
Before ordering new hardware, try these three adjustments:
- Tune `vm.dirtyratio` — Lower it to prevent write bursts from flooding disk queues: `sysctl -w vm.dirtyratio=10`
- Enable the deadline I/O scheduler — It's often better for throughput on spinning disks: `echo deadline > /sys/block/sda/queue/scheduler`
- Check swap activity — If `vmstat 1` shows continuous `si`/`so` columns, your system is thrashing. Add RAM or reduce memory-hungry processes.
🎯 Conclusion
Disk I/O troubleshooting doesn't have to be a guessing game. With `iostat` for detection, `iotop` for identification, and `ioping` for validation, you have a complete diagnostic pipeline. A smart sysadmin measures before they act — and these tools give you the data to make informed decisions.
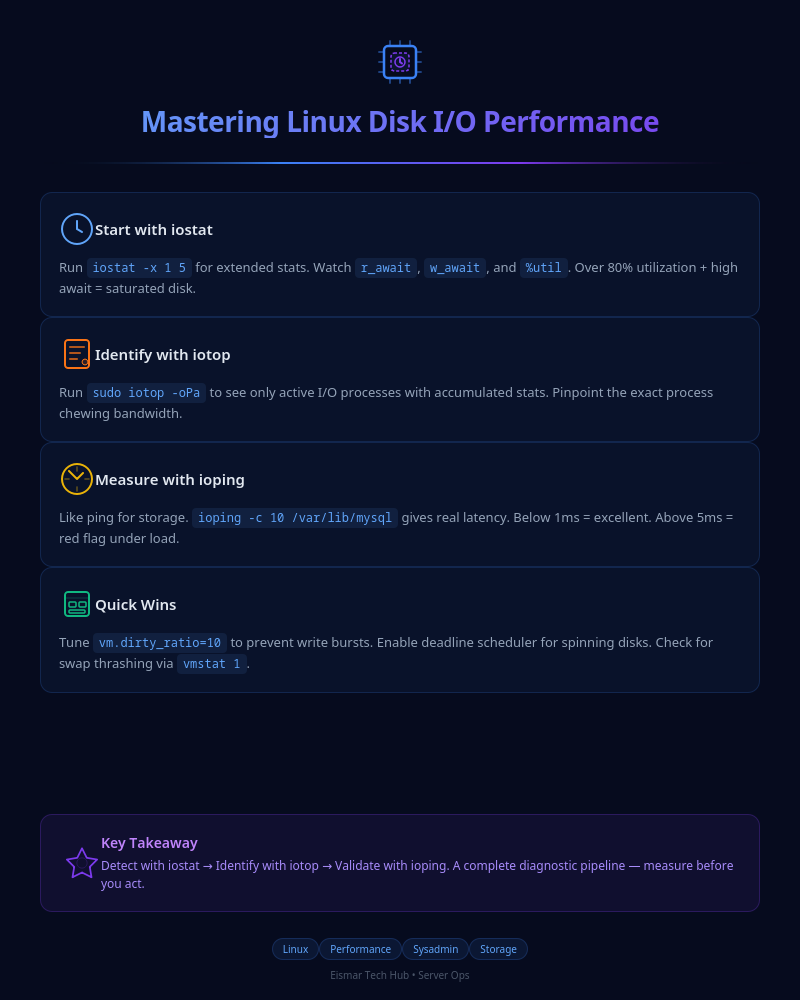
Infographic: Mastering Linux Disk I/O Performance

💬 0 Comments