Every Linux sysadmin has been there. You SSH into a production server, and something is wrong. Load average is through the roof, the website is crawling, and `top` shows a dozen mysterious processes. What do you do? Before you can fix a problem, you need to understand what's running — and that means mastering Linux process management.
Processes are the heartbeat of any Linux system. Every running program, every background daemon, every cron job — they're all processes. Knowing how to inspect, control, prioritise, and isolate them is what separates a button-pusher from a real sysadmin. This guide covers everything from the basics of `ps` to advanced resource control with cgroups v2.
Understanding Linux Processes: The Basics
A process is simply an instance of a running program. When you type `ls` in your terminal, the shell forks a new process, loads the `ls` binary into memory, executes it, and waits for it to finish. Every process gets a unique PID (Process ID) — a number that identifies it to the kernel.
Process States
Every process on a Linux system is in one of these states at any given moment:
| State | Code | What It Means |
|---|---|---|
| Running | `R` | Actively executing or in the run queue |
| Sleeping | `S` | Waiting for an event (I/O, timer, signal) |
| Uninterruptible Sleep | `D` | Waiting for I/O — usually disk. Cannot be killed until the I/O completes |
| Zombie | `Z` | Process has finished but its parent hasn't collected its exit code |
| Stopped | `T` | Paused by a signal (e.g., SIGSTOP) |
Pro tip: A high number of processes in `D` (uninterruptible sleep) usually means a disk problem. You can't kill these with `kill -9` — you have to fix the underlying I/O issue.
Parent-Child Relationship
Every process (except PID 1 — `systemd` or `init`) has a parent process (PPID). When a parent dies, its children become orphans and are adopted by PID 1. This is why properly designed daemons handle graceful shutdown — they need to clean up their child processes before exiting.
```bash
See the process tree
pstree -p
Show PID, PPID, and command for every process
ps -eo pid,ppid,cmd ```The ps Command: Your First and Most Powerful Tool
`ps` is the Swiss Army knife of process inspection. While most sysadmins know `ps aux`, there's so much more under the hood.
Essential ps Invocations
```bash
Classic: all processes for all users
ps aux
BSD style with custom output
ps aux --sort=-%mem # Sort by memory usage (descending) ps aux --sort=-%cpu # Sort by CPU usage (descending)See the full command line (not truncated)
ps auxwwShow process tree
ps axjfCustom output format — show exactly what you need
ps -eo pid,ppid,user,%cpu,%mem,stat,start,time,cmd --sort=-%cpuShow threads within a process
ps -eLf | grep nginxShow only processes owned by a specific user
ps -u www-data -o pid,cmd,%mem ```Reading ps Output
When you run `ps aux`, the `STAT` column tells the story. A process showing `R+` is actively running in the foreground. `S` means it's sleeping peacefully. `D` means it's stuck waiting for disk I/O. `Z` means it's a zombie — dead but not reaped. And the `+` means it's in the foreground process group.
The most useful trick: Pipe `ps` to filter out noise:
```bash
Find the top 5 memory consumers
ps aux --sort=-%mem | head -6
Find all processes running as root
ps -U root -o pid,cmd --no-headersCount total processes
ps aux --no-headers | wc -l ```A healthy server typically runs 150-400 processes depending on workload. If you see 1000+, something is probably spawning too many threads or processes.
Real-Time Monitoring with top and htop
While `ps` gives you a snapshot, `top` and `htop` give you live, refreshing views of system activity.
top: Built-In and Always Available
```bash
top
```
Inside `top`, the interactive commands are worth memorising:
| Key | What It Does |
|---|---|
| `P` | Sort by CPU usage |
| `M` | Sort by memory usage |
| `k` | Kill a process (prompts for PID) |
| `r` | Renice a process |
| `H` | Toggle threads view |
| `1` | Toggle per-CPU stats |
| `u` | Filter by username |
| `W` | Write config to ~/.toprc |
```bash
Batch mode — useful for scripts and logging
top -b -n 1
Monitor only processes owned by a specific user
top -u www-data ```htop: Nicer, but Not Always Installed
```bash
Install it
sudo apt install htop -y # Debian/Ubuntu
sudo dnf install htop -y # RHEL/Fedora
```
htop shows:
- Colour-coded CPU and memory bars
- Tree view (F5)
- Mouse support
- Easy process killing with arrow keys + F9
```bash
Tree view from the command line
htop -t
```
Process Signals: The Language of Control
Signals are how the kernel and users communicate with processes. Every sysadmin must know these six:
| Signal | Number | Default Action | When to Use |
|---|---|---|---|
| SIGHUP | 1 | Terminate | Reload config (daemons) or hangup terminal |
| SIGINT | 2 | Terminate | Ctrl+C — interrupt a foreground process |
| SIGKILL | 9 | Kill | Force kill — cannot be caught or ignored |
| SIGTERM | 15 | Terminate | Graceful shutdown — ask the process to exit |
| SIGSTOP | 19 | Stop | Pause a process (cannot be caught) |
| SIGCONT | 18 | Continue | Resume a stopped process |
```bash
Graceful shutdown
kill -15 1234 # or just: kill 1234
Force kill (last resort)
kill -9 1234 # or: kill -SIGKILL 1234Reload configuration (apache example)
kill -1 $(cat /var/run/apache2.pid) kill -HUP $(cat /var/run/apache2.pid)Pause and resume a process
kill -STOP 1234 # Pause it kill -CONT 1234 # Resume itKill all processes by name
pkill -f "node server.js" killall nginx ```Golden rule of killing processes: Always try SIGTERM (15) first. Give the process 5-10 seconds to clean up. Only escalate to SIGKILL (9) if it ignores you. SIGKILL doesn't let the process close file handles, flush buffers, or clean up shared memory — it can leave your system in an inconsistent state.
Process Priority: nice and renice
Linux uses a priority system called nice values to determine how much CPU time a process gets. The range is -20 (highest priority) to +19 (lowest priority). The default is 0.
```bash
Start a process with low priority
nice -n 19 ./backup.sh
Change the priority of a running process
renice -n 10 -p 1234Renice all processes owned by a user
renice -n 5 -u www-data ```When to use nice:
- High-priority (+19): Batch processing, backups, log compression — anything that shouldn't impact user-facing services
- Default (0): Most normal processes
- Low-priority (-20 to -5): Latency-sensitive services (database servers, VoIP, real-time apps). Use with caution!
```bash
Boost a database process to high priority
sudo renice -n -5 -p $(pgrep mysqld)
Lower the priority of a log rotator
sudo renice -n 15 -p $(pgrep logrotate) ```Warning: Only root can set negative nice values (higher priority). Regular users can only make their processes nicer (lower priority). This prevents a rogue user from hogging the CPU.
cgroups v2: Fine-Grained Resource Control
cgroups (control groups) are the kernel's mechanism for limiting, accounting for, and isolating resource usage (CPU, memory, disk I/O, network) of process groups. Modern Linux uses cgroups v2 (unified hierarchy), managed primarily through systemd.
systemd Resource Control
Every systemd service can have resource limits applied directly in its unit file:
```ini
[Service]
CPUQuota=50% # Limit to 50% of a single CPU
MemoryMax=512M # Hard memory limit
MemoryHigh=384M # Soft memory limit (triggers reclaim)
TasksMax=100 # Max number of tasks (processes/threads)
IOReadBandwidthMax=/dev/sda 100M # Read bandwidth limit
IOWriteBandwidthMax=/dev/sda 50M # Write bandwidth limit
```
Apply and verify:
```bash
sudo systemctl daemon-reload
sudo systemctl restart myapp.service
Check current resource usage
systemctl show myapp.service --property=MemoryCurrent systemctl show myapp.service --property=CPUUsageNSec ```Using systemd-run for Ad-Hoc Resource Control
Don't want to write a service file? Use `systemd-run` to apply limits on the fly:
```bash
Run a command with a memory limit
systemd-run --user --scope -p MemoryMax=256M ./memory-hungry-script.sh
Run with CPU limit
sudo systemd-run --scope -p CPUQuota=30% ./slow-down.shScoped cgroup — run with I/O limit
sudo systemd-run --scope -p IOReadBandwidthMax="/dev/sda 10M" rsync -av /large-files/ /backup/ ```cgroups v2 Hierarchy
You can inspect cgroups directly through the filesystem at `/sys/fs/cgroup/`:
```bash
See all cgroup controllers
ls /sys/fs/cgroup/
Check memory usage for a systemd service
cat /sys/fs/cgroup/system.slice/myapp.service/memory.currentSet a memory max limit dynamically
echo 536870912 > /sys/fs/cgroup/system.slice/myapp.service/memory.max ```When to Use cgroups vs nice
| Tool | Controls | Best For |
|---|---|---|
| `nice`/`renice` | CPU scheduling priority | Quick adjustments, interactive processes |
| `cgroups` | CPU, memory, I/O limits | Production workloads, containers, multi-tenant systems |
| `ulimit` | Per-process limits (file descriptors, stack size) | Preventing runaway single processes |
| `systemd` resource control | All of the above + service lifecycle | Long-running services, daemons |
Zombie Processes: Spotting and Dealing With Them
Zombie processes are dead processes that haven't been reaped by their parent. They show up in `ps` with state `Z` and a `[defunct]` tag.
```bash
Find all zombies
ps aux | awk '{if ($8 == "Z") print}'
Count zombies
ps aux --no-headers | awk '{if ($8 == "Z") print}' | wc -l ```Why zombies are bad: A zombie process has already released its memory and resources, but it still occupies a slot in the process table. Since the kernel's process table has a fixed maximum size (usually PID_MAX = 32768 by default, 4194304 with modern kernels), too many zombies can prevent new processes from being created — a denial-of-service condition.
How to fix zombies:
- Find the parent: `ps -o ppid= -p
` - If the parent is alive, send SIGCHLD: `kill -CHLD
` — this tells the parent to reap its children - If that doesn't work, kill the parent: `kill
` — orphans get adopted and reaped by init/systemd - If the parent is PID 1 (systemd) and it's not reaping, you have a kernel bug — reboot
```bash
Find zombie count system-wide
grep zombies /proc/stat
Or more directly
zombies=$(ps aux --no-headers | awk '{if ($8 == "Z") print}' | wc -l) echo "Zombie processes: $zombies" ```Practical Workflows for Daily Sysadmin Work
1. Find What's Hogging Resources
```bash
CPU hogs (top 5)
ps aux --sort=-%cpu | head -6
Memory hogs (top 5)
ps aux --sort=-%mem | head -6Most active processes by I/O (requires iotop)
sudo iotop -oPa -n 1 ```2. Kill a Stuck Process Gracefully
```bash
Step 1: Find the process
ps aux | grep stuck-app
Step 2: Try graceful termination
kill -15 12345 sleep 5Step 3: Check if it's still alive
ps -p 12345 --no-headersStep 4: Force kill if still running
kill -9 12345 ```3. Track Down Resource Leaks
```bash
Watch memory usage of a specific process over time
while true; do
ps -o rss -p 12345 --no-headers | awk '{print strftime("%H:%M:%S"), $1/1024 " MB"}'
sleep 5
done
```
4. Find Unnecessary Running Services
```bash
List all running systemd services
systemctl list-units --type=service --state=running
Disable anything that shouldn't be there
sudo systemctl disable --now bluetooth.service ```Conclusion
Linux process management is a skill you build one incident at a time. Start with `ps` and `top` — they're always available and incredibly powerful once you learn to read their output. Add `kill` and signal handling to your muscle memory. Then graduate to `nice`/`renice` for priority adjustments and `cgroups`/systemd for real resource control in production environments.
The sysadmins who master these tools are the ones who can diagnose a server under load in minutes, not hours. They're the ones who sleep through the night because their resource limits prevent any single process from taking down the entire server. And they're the ones who can confidently say, "I know exactly what's running on my systems."
Next time your server slows down, don't reboot. Start with `ps aux --sort=-%cpu | head -20` and work your way down. You'll not only fix the problem — you'll understand it.
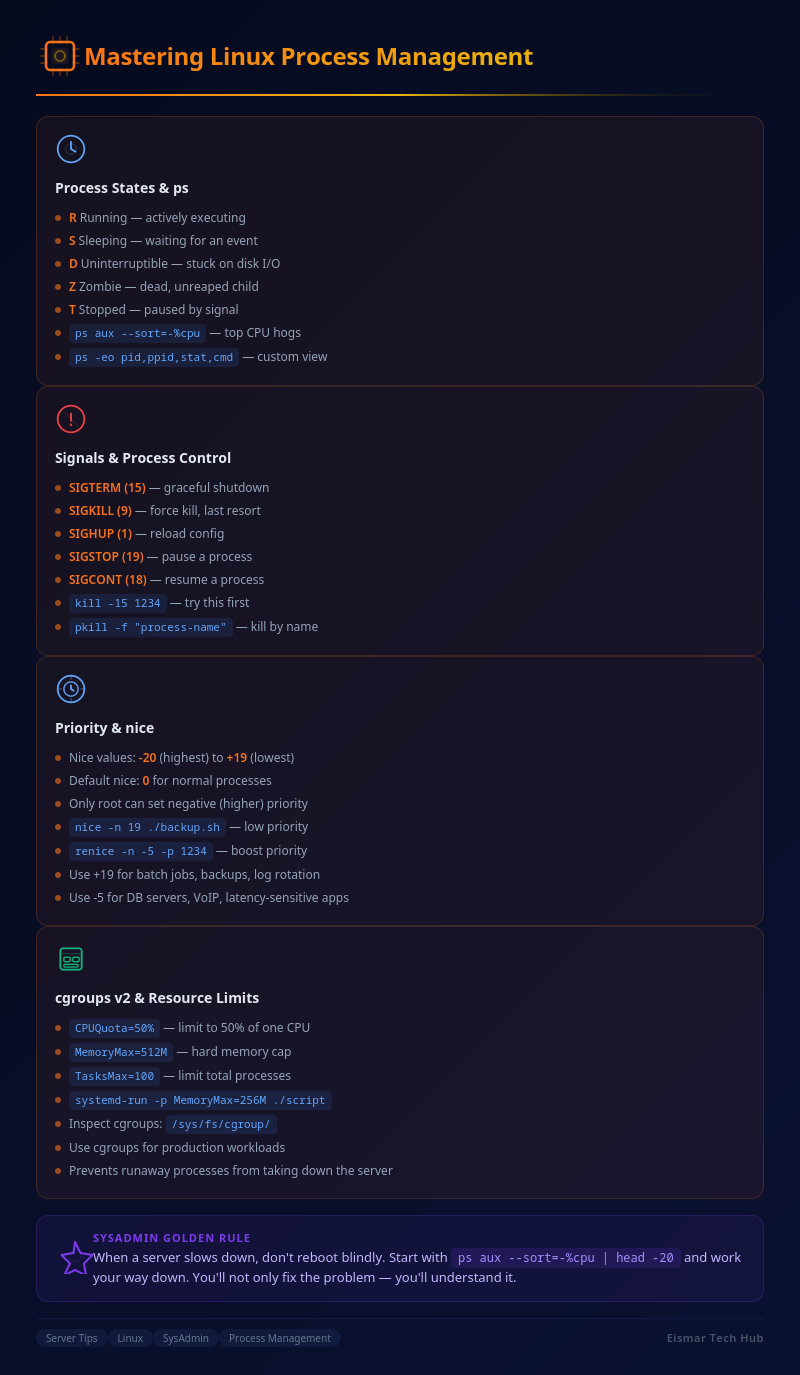
Infographic: Mastering Linux Process Management

💬 0 Comments