Your application is fine. Your web server is fine. But the database is breathing hard, and every dashboard you touch takes three seconds to load. If you have ever been that sysadmin, staring at `top` while mysqld eats 400% CPU and wondering where to start — this guide is for you.
Database performance tuning is one of those skills that separates a server operator from a server engineer. The good news? You do not need to be a DBA to make dramatic improvements. Most MySQL and MariaDB performance problems come from a handful of repeatable causes: missing indexes, badly written queries, misconfigured buffers, and tables that were designed without a thought for how they would be queried. In this article, we will walk through a practical, ordered workflow — from finding the slow queries, to understanding why they are slow, to fixing them at the schema, query, and configuration level.
Step 1: Find the Slow Queries First — Never Tune Blind
The biggest mistake sysadmins make is editing `my.cnf` before they even know what is actually slow. Configuration changes without evidence are just guesswork with extra steps. Start by switching on the slow query log.
```ini
slowquerylog = ON
slowquerylog_file = /var/log/mysql/mysql-slow.log
longquerytime = 2
logqueriesnotusingindexes = ON
```
With `longquerytime = 2`, any query taking longer than two seconds gets logged. On a busy server, set it to 1 for a few days, collect the data, then raise it back. The `logqueriesnotusingindexes` flag is gold — it catches the queries that are silently scanning entire tables.
Once you have a log, aggregate it instead of reading it line by line. `mysqldumpslow` ships with MySQL:
```bash
mysqldumpslow -s at /var/log/mysql/mysql-slow.log | head -20
```
This sorts by average time and groups identical queries (ignoring literal values), so you instantly see the top offenders. For serious analysis, Percona's `pt-query-digest` produces a beautiful report grouping queries by total response time — the classic "95% of your pain comes from 5% of your queries" insight made concrete.
Step 2: EXPLAIN — Read the Query Plan Like a Pro
Now that you have the culprit queries, you need to understand why they crawl. Prefix the query with `EXPLAIN` and MySQL will show you its execution plan instead of running it.
```sql
EXPLAIN SELECT o.id, c.name FROM orders o
JOIN customers c ON o.customer_id = c.id
WHERE o.status = 'pending' ORDER BY o.created_at DESC;
```
The columns that matter most:
- type — this is your access path. `const` and `ref` are excellent (index lookups). `range` is fine. `ALL` means a full table scan — usually the thing killing you. `index` is a full index scan — better than `ALL` but still bad.
- key — which index MySQL actually chose. If it is NULL with a `WHERE` clause, you are scanning.
- rows — the estimated number of rows examined. Compare it with the actual row count of the table. A query examining 2 million rows to return 20 is a design problem.
- Extra — watch for `Using filesort` and `Using temporary`. "Filesort" does not mean disk files (often it is in-memory sorting), but it does mean MySQL is sorting a result set that your index could have delivered pre-sorted. `Using temporary` means MySQL built a temp table — common with `GROUP BY` or `DISTINCT` on unindexed columns.
The moment you see `ALL`, `Using filesort`, or `Using temporary` on a hot query, you have found your smoking gun.
Step 3: Indexes Done Right
Indexes are the single highest-leverage fix in this entire article. A missing index can turn a 5-millisecond query into a 5-second one. But indexes are not free — every write must maintain them, and every one consumes disk and memory. So you want the right indexes, not more of them.
Composite index column order matters. For `WHERE a = ? AND b = ?`, an index on `(a, b)` is perfect. For `WHERE a = ? AND c = ?`, an index on `(a, b, c)` is useless beyond the first column — MySQL can only use the leftmost prefix. Rule of thumb: put equality columns first, then the column used for range or ordering.
Covering indexes are a hidden superpower. If every column the query needs lives inside the index itself, MySQL never touches the table at all. `EXPLAIN` will show `Using index` in Extra. For a dashboard query that repeatedly reads the same handful of columns, a covering index can be 10–100x faster.
Ordering can be served by an index. An index on `(status, createdat)` makes `WHERE status = 'pending' ORDER BY createdat DESC` read the rows already in the right order — no filesort.
Don't over-index. Each index slows INSERT/UPDATE. If a table has eight indexes and only three are ever used (check with `performance_schema` or `SHOW INDEX` usage stats), drop the dead ones. Also remember: a redundant index `(a)` is fully covered by `(a, b)` — drop the shorter one.
Step 4: InnoDB Buffer Pool — Your Best Bang for the Buck
Modern MySQL and MariaDB default to InnoDB, and InnoDB lives or dies by its buffer pool — the memory area that caches table data and indexes. If your data fits in the buffer pool, queries hit memory. If it does not, every miss is a disk read.
```ini
innodbbufferpool_size = 8G # ~70-80% of dedicated DB server RAM
innodbbufferpool_instances = 8 # 1GB per instance is the sweet spot
```
A dedicated database server with 16GB RAM should comfortably give 12GB to the buffer pool. On a shared box, be more conservative. The classic way to check if the pool is big enough:
```sql
SHOW GLOBAL STATUS LIKE 'Innodbbufferpoolreadrequests';
SHOW GLOBAL STATUS LIKE 'Innodbbufferpool_reads';
```
`reads` are disk reads; `read_requests` are total. If your hit ratio (`(requests - reads) / requests`) is below 99%, the buffer pool is too small — or your queries are scanning too much data (fix the queries first; throwing RAM at a full-table-scan query just makes it scan faster).
Two more InnoDB knobs worth knowing:
- `innodblogfile_size` — the redo log. Too small causes frequent flushes and "checkpoint age" warnings. 256MB–1GB per log file is reasonable for write-heavy workloads.
- `innodbflushlogattrx_commit` — the classic durability/performance trade-off. `1` (default) fsyncs on every commit — safe but slow. `2` flushes to OS cache only — much faster, loses at most 1 second of transactions on a power loss. For non-financial workloads, `2` is a legitimate, widely used choice.
Step 5: Schema Hygiene — Fix the Table, Not Just the Query
Sometimes no index in the world can save a badly designed schema. A few patterns to look for:
- SELECT \* — on wide tables this drags megabytes of unnecessary columns across the network and into temp tables. Select only what you need.
- Wrong data types — searching a `VARCHAR(255)` for a number, or storing dates as strings, prevents efficient comparison and bloats indexes. Use `INT`, `DATETIME`, `ENUM` where they belong.
- TEXT/BLOB abuse — `TEXT` columns cannot be fully indexed without prefix indexes, and InnoDB stores large values off-page. If you only need 200 characters, `VARCHAR(200)` beats `TEXT`.
- Missing `NOT NULL` — nullable columns make indexing and query planning harder than you think. If a column is never null, say so.
- Over-normalization on hot paths — sometimes a denormalized summary column or a precomputed aggregate table saves a join that runs 50,000 times a day. Rules are for beginners; measure first, then bend them deliberately.
Step 6: Test, Monitor, and Prove Your Changes
Never apply a "tuning tip from a blog" and call it a day. Measure before, apply, measure after.
Load-test with a benchmark: `sysbench` is the standard tool.
```bash
sysbench oltpreadwrite --table-size=1000000 --mysql-db=bench \
--threads=16 --time=60 prepare
sysbench oltpreadwrite --table-size=1000000 --mysql-db=bench \
--threads=16 --time=60 run
```
Run it before your changes, record the transactions-per-second and latency percentiles, then run it again after. If TPS went up and p95 latency went down, you improved something real.
Use the built-in advisor: `mysqltuner.pl` is a single Perl script that connects to your server and prints a prioritized list of recommendations. It is opinionated, but as a starting checklist it catches the classics — buffer pool sizing, cache hit ratios, and connection limits.
Watch `performanceschema`: MySQL's built-in instrumentation can tell you which indexes are used (`sys.schemaunusedindexes`) and which queries consume the most time (`sys.statementanalysis`). If your MySQL has the `sys` schema, these views turn performance archaeology into a SELECT statement.
Step 7: The Quick Wins Checklist
Finally, here is the "do this before lunch" list that fixes a shocking number of production databases:
| Setting | Typical value | Why |
|---|---|---|
| `innodbbufferpoolsize` | 70–80% of RAM (dedicated) | Keeps hot data in memory |
| `maxconnections` | 100–300, not 10,000 | Too many = connection storms, swapping |
| `threadcachesize` | 16–64 | Reuses threads, avoids spawn churn |
| `tmptablesize` / `maxheaptablesize` | 64–256MB | Reduces disk-based temp tables |
| `joinbuffersize` | 1–4MB per session | Helps index-less joins (fix queries too) |
| `keybuffersize` | 64–256MB | Only matters for MyISAM tables |
| `longquerytime` | 1–2s with slow log ON | Visibility into the real problem |
| `innodbflushlogattrxcommit` | 1 or 2 (know the trade-off) | Durability vs. write throughput |
One more thing: the MySQL query cache is gone in MySQL 8.0 and MariaDB 10.1.4+ (deprecated). If an old tutorial tells you to crank `querycachesize`, ignore it — modern servers benefit from the buffer pool and better caching layers (Redis, Varnish, or application-level caches) instead.
Conclusion
Database tuning is not magic — it is an orderly investigation. Enable the slow query log, find the offenders, read their execution plans, add the right indexes, size the buffer pool honestly, and prove every change with a benchmark. You will be surprised how often a "dying" MySQL server was actually one missing index and one wrong `my.cnf` value away from being perfectly healthy.
A smart operator makes informed decisions. Your database will thank you — and so will the developers who stop pinging you about slow pages.
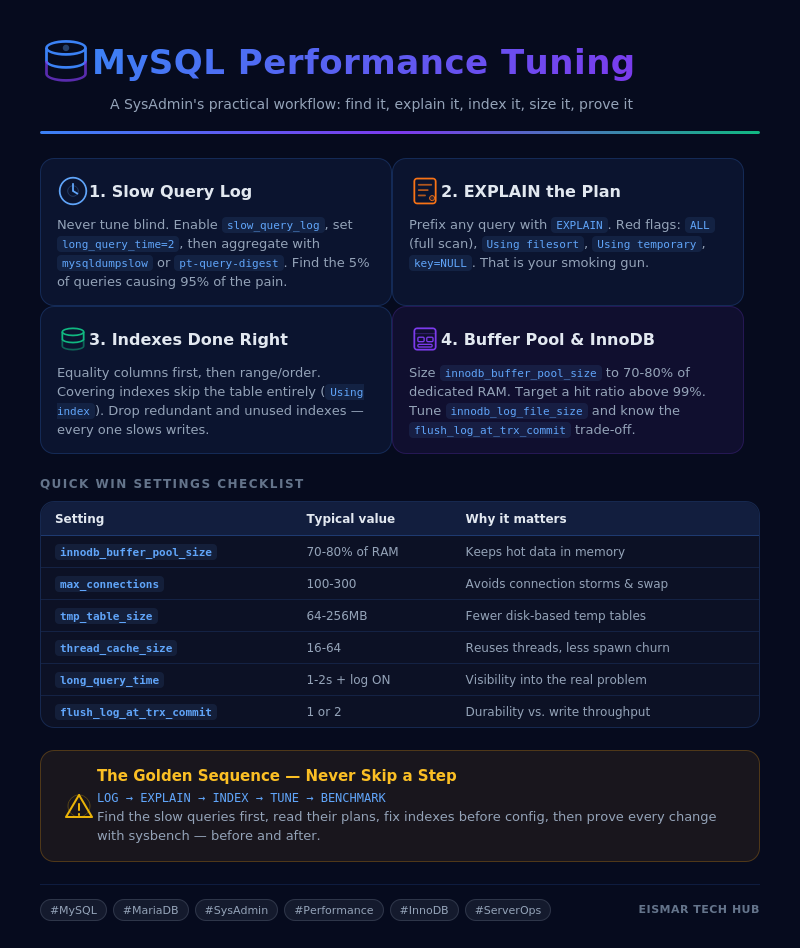
Infographic: MySQL Performance Tuning

💬 0 Comments