Every sysadmin knows the feeling: it is 3:00 AM, your phone buzzes, and a user is asking why the website is down — while you are scrambling to SSH into a server that has been silently degrading for hours. The uncomfortable truth is that most outages are not sudden. CPU creeps up, disk fills slowly, memory leaks build over weeks. The only reason they feel sudden is that nobody was watching.
This is where a proper monitoring stack changes everything. Instead of reacting to complaints, you get alerted the moment a metric crosses a threshold — often before a single user notices anything wrong. In this guide, we will build a complete monitoring stack for your Linux servers using three open-source tools that together form the industry standard: Prometheus for collecting and storing metrics, Grafana for beautiful dashboards, and Alertmanager for routing notifications when something goes wrong. No proprietary licenses, no per-host fees, just solid, battle-tested tooling.
Why Monitoring Matters More Than Ever
Modern infrastructure is bigger and more distributed than it was a decade ago, but the fundamentals of keeping servers healthy have not changed: you need to know what is happening, right now, on every machine you run. Monitoring gives you three superpowers.
First, early detection. A disk at 91% today will be a disk at 100% next week. A gradual rise in memory usage tells you a process is leaking long before it triggers the OOM killer. Monitoring turns these silent time bombs into routine, low-priority alerts you can fix during working hours.
Second, historical context. When something does break, the first question is always "what changed?" With metrics stored over time, you can overlay a deployment timestamp on your graphs and watch the memory curve spike at exactly 14:32 — the moment that new release went live. This turns guesswork into evidence.
Third, capacity planning. "How much RAM do we need to add?" is impossible to answer from a gut feeling. With months of metric history, you can project growth rates, spot seasonal patterns, and buy hardware or resize instances based on real numbers instead of hope.
The Stack: Prometheus, Grafana and Alertmanager
Before we get our hands dirty, let us understand the architecture, because knowing why each piece exists makes configuration far easier.
Prometheus is the heart of the stack. It is a time-series database that pulls metrics from your servers on a schedule (the default is every 15 seconds), rather than waiting for servers to push data to it. This pull model is a big deal: you can tell at a glance whether a machine is alive, because a missing scrape is itself a signal. Prometheus stores everything with high-precision timestamps and comes with a powerful query language called PromQL that lets you slice, aggregate and correlate metrics in real time.
nodeexporter is the small agent you install on every Linux host you want to monitor. It exposes hundreds of standard system metrics — CPU, memory, disk, network, filesystem, and more — over a simple HTTP endpoint on port 9100. Prometheus scrapes that endpoint. You do not need to install anything heavy on your monitored servers; nodeexporter is a single static binary with no dependencies.
Grafana sits on top of Prometheus and turns raw numbers into dashboards. It connects to Prometheus as a data source, and you build panels: line graphs, gauges, heatmaps, stat cards. Once you have a dashboard you like, you can share it with your team or even export it as JSON and import it on other Grafana instances. There is also a huge library of pre-built dashboards in the Grafana community, so you rarely start from a blank canvas.
Alertmanager handles the "so what?" part of monitoring. Prometheus itself can evaluate alert rules against your metrics, but when an alert fires, it hands off to Alertmanager, which is responsible for grouping, deduplication, and routing notifications to email, Slack, Telegram, or any webhook. It also handles the thorny problem of alert fatigue: if five related alerts fire at once, Alertmanager can group them into a single notification instead of spamming your team.
Standing Up the Stack in Minutes
The fastest way to get all three running on a single server is with Docker Compose, which is perfect for a homelab or a small production setup. If Docker is not an option on your environment, every component also installs cleanly from official packages on Debian, Ubuntu, and RHEL-family distributions.
Start by creating a directory for the stack and a `docker-compose.yml` file. The core services look like this: a Prometheus container that mounts a configuration file and a data volume, a Grafana container exposing port 3000, and a nodeexporter container that monitors the host itself. For the machines you want to watch, either run nodeexporter as a systemd service or add them as additional containers.
The heart of the configuration is `prometheus.yml`. Inside it you define scrape targets — the list of endpoints Prometheus should collect from. A minimal config declares a global scrape interval, then a `scrapeconfigs` section listing jobs. Each job has a name and a list of static targets; for nodeexporter on the local machine that is simply `localhost:9100`, and for remote servers you add `server1.example.com:9100`, and so on. Every target you add is one more server you can see on your dashboards.
Once everything is up, Grafana is the star of the show. Log in at `http://your-server:3000` with the default admin credentials, add Prometheus as a data source (just point it at `http://prometheus:9090` if both run in Docker), and import a community dashboard. One of the most popular is the official Node Exporter Full dashboard, which gives you CPU, memory, disk, and network panels out of the box. In under ten minutes you go from zero to a live, scrolling overview of every server you manage.
What to Actually Monitor: The Golden Signals
A monitoring stack is only as good as the metrics you decide to watch. Collecting everything is easy; knowing what matters is the craft. The industry has converged on four "golden signals" that catch the vast majority of problems, plus a few Linux-specific must-haves.
CPU and load come first. High CPU is not automatically bad — it may mean your server is working hard and doing a great job. The thing to watch is sustained high load with no idle headroom, or load average that keeps climbing while throughput stays flat, which usually signals a runaway process or a thread-pool leak.
Memory deserves a special warning for Linux beginners: the `free` command's "used" number is misleading because Linux caches aggressively. What matters is the available metric, swap usage, and the `vmstat` numbers for swapping. A server that is continuously swapping is a server that is thrashing — add RAM or find the leak.
Disk space and I/O are the classic silent killers. Track filesystem usage percentage per mount, inode usage (you can run out of inodes while space looks fine!), and I/O wait. A disk at 99% does not fail instantly — but a full disk on a database server can corrupt writes or crash applications in the worst possible way.
Network signals round out the picture: bandwidth in and out, packet loss, and error counters. A spike in TCP retransmits is often the first clue that a switch is failing or a link is saturated, long before anyone complains about slowness.
At the application level, think in terms of the golden signals: latency (how long requests take), traffic (how many requests per second), errors (how many fail), and saturation (how close to capacity you are). Even a simple custom exporter that exposes "requests per second" and "error count" for your main web app will pay for itself within a week.
Alerting Done Right: Avoid the Boy Who Cried Wolf
The entire point of this exercise is that your phone should only ring when something actually needs you. Bad alerting — noisy, vague, or always-firing rules — is worse than no alerting, because your team will learn to ignore every notification.
Start with meaningful thresholds. Alert on sustained conditions, not blips. A CPU spike for 30 seconds is noise; CPU above 90% for 15 minutes is a story. Prometheus alert rules support a `for` clause precisely for this: the condition must hold continuously for the specified duration before the alert fires. Use it liberally.
Define severity levels and route them separately. Critical alerts — host down, disk full, service unreachable — should page someone immediately via push notification or SMS. Warning alerts — disk above 80%, load trending up — can go to a quieter channel and be reviewed during the day. If everything is critical, nothing is critical.
Finally, keep alerting rules with your infrastructure as code. Store your `prometheus.yml` and alert rules in git, just like your application code. When a colleague asks "why did we get paged at 4 AM?", you can point at the exact rule that fired, its threshold, and the commit that changed it. This is the difference between a monitoring stack and a monitoring culture.
From Dashboards to Decisions
Here is the loop that separates great sysadmins from the rest: you do not just look at dashboards when something breaks — you use them before it breaks, and you review them after it breaks.
Set aside ten minutes each morning to scan your dashboards: any new spikes, any mounts creeping toward full, any queues building up. Over time you will learn the "normal shape" of each server, and deviations will jump out at you immediately. When an incident does happen, resist the urge to restart everything blindly. Open the metrics, find the moment the curve changed, and correlate it with your deployment history. Nine times out of ten, the graph tells you exactly which change caused the problem.
And when you fix something, add an alert for it. That is the compounding habit: every incident you survive becomes a rule that prevents the next one. After a few months, your stack is no longer just monitoring your servers — it is encoding everything you have learned about them.
Conclusion
You do not need an expensive enterprise platform to monitor your Linux servers properly. Prometheus, Grafana, and Alertmanager give you industrial-grade observability for free, with a small footprint and a huge community behind them. Start small: one host, one dashboard, two alert rules. Then expand as you get comfortable.
The real win is not the graphs — it is the peace of mind. When your phone buzzes at 3:00 AM, it will be because something genuinely needs you, and you will already know exactly what it is. That is what a smart operator calls a good night's sleep.
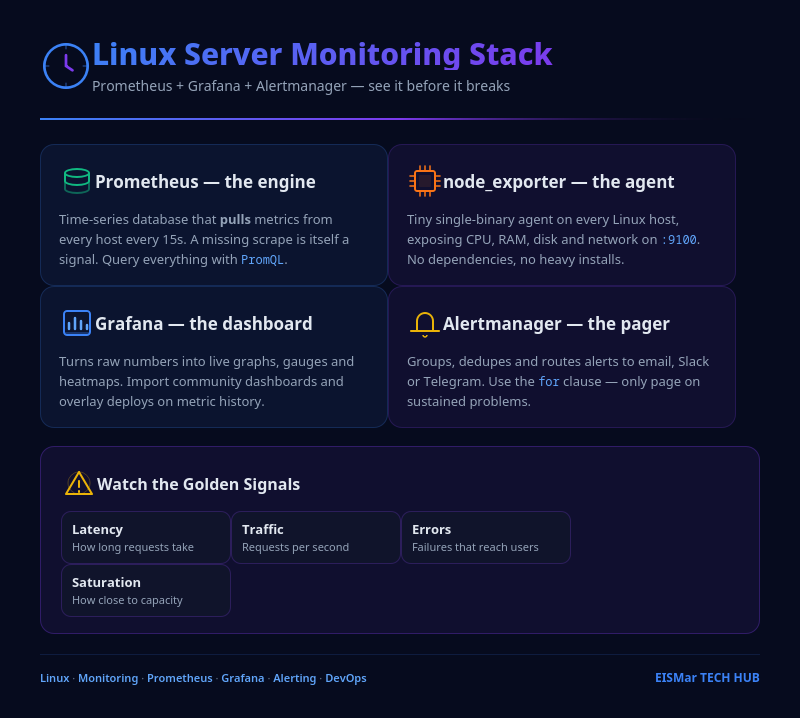
Infographic: Linux Server Monitoring Stack

💬 0 Comments