Why Your Linux Server Is Slow: A Sysadmin's Diagnostic Workflow
So your server is running slower than a Docker build on a dial-up connection. Before you blame the kernel, the cloud provider, or your coworker who "just ran a quick script," let's walk through a proper diagnostic workflow. By the time we're done, you'll look like a hero — or at least like someone who knows what `top` actually does.
Step 1: Load Averages — The Triple Lie
When you run `uptime` or `top` and see something like `load average: 8.47, 5.32, 3.18`, the knee-jerk reaction is "8 processes waiting? Must be CPU." But load averages count both CPU-bound and I/O-wait processes. A server with a fried disk can show load 15 while sitting at 2% CPU. The three numbers (1m, 5m, 15m) tell a story — if the 1m is spiking but 15m is chill, something just went sideways. Check that with `mpstat -P ALL 1 5` to separate CPU load from I/O wait (the `%iowait` column). If iowait is above 5%, your disk is the bottleneck, not your CPU.
Step 2: Memory — Free vs. Available (The Classic Trap)
If you're still running `free -h` and panicking because it shows "used: 47G" on a 64GB server, congratulations — you've fallen for the oldest trick in Linux's book. Linux loves using free RAM for disk cache. That `buff/cache` column? That's not wasted memory — it's your server being smart. The real number is `available`, which tells you how much memory is actually free for new applications. Use `free -h` and look at row two (`-/+ buffers/cache` on older systems), or just run `htop` and look at the green/yellow memory bar properly. Also check swap usage — if `swapon --show` shows swap in use while RAM is available, your `vm.swappiness` is set too aggressively (default 60 — try 10 for servers).
Step 3: Disk I/O — The Silent Killer
Nothing destroys server performance faster than a disk that's screaming for mercy. Run `iostat -x 1 3` and look at `%util`. Here's the twist: `%util` can hit 100% on modern NVMe drives and they're still fine — the metric was designed for spinning rust. Instead, watch `await` (average I/O response time). If await > 20ms on SSD or > 100ms on HDD, your storage is choking. The real culprit? Often it's logging. Check if rsyslog or your application logs are on the same disk as the database. Pro tip: `fatrace` shows you exactly which process is generating the most disk activity in real-time.
Step 4: Zombie Processes & Runaway Children
Sometimes the problem isn't load — it's processes that refuse to die. Zombie processes (state `Z` in `ps aux`) are dead processes waiting for their parent to read their exit status. A few zombies is normal; hundreds means something's broken upstream. Use `ps aux | grep 'Z'` to spot them. Worse are runaway children — scripts that fork-bomb your server because of a logic error. Set `ulimit -u` (max user processes) in `/etc/security/limits.conf` to prevent one bad Apple from taking down the whole orchard.
Conclusion
The next time your server feels sluggish, don't randomly restart services or `kill -9` everything in sight. Follow the workflow: CPU → Memory → Disk → Processes. Each layer tells you something the others can't. A smart sysadmin doesn't guess — they measure. And if all else fails, remember: `restart` is not a diagnostic tool, but it is a very effective one.
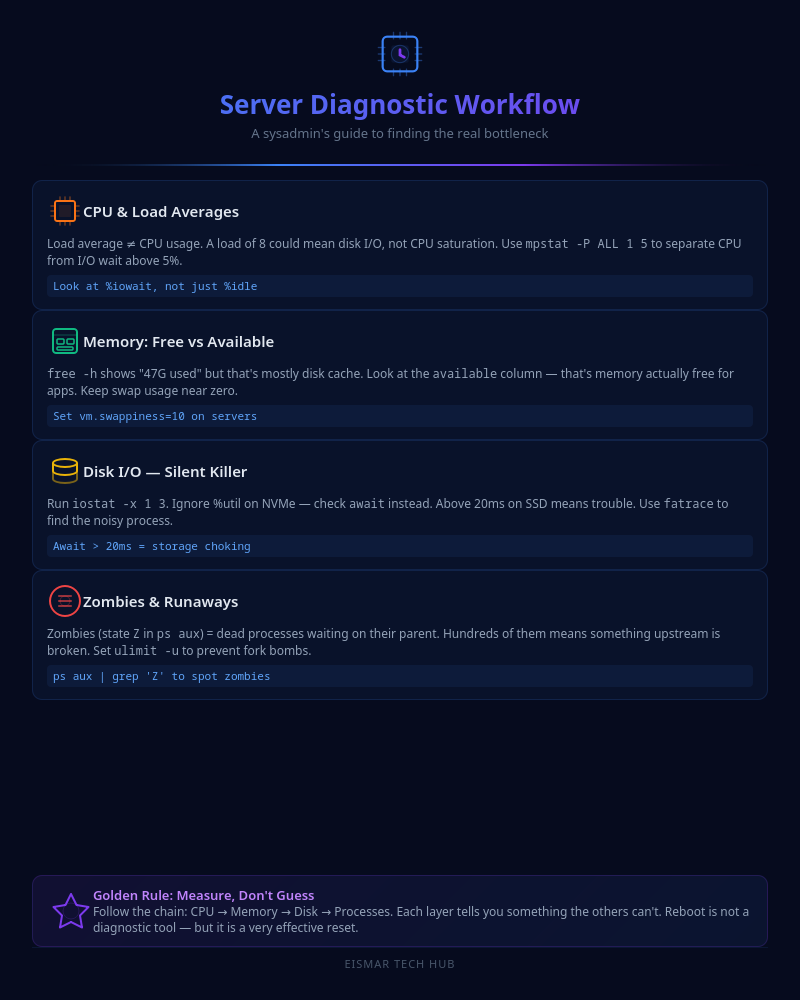
Infographic: Server Diagnostic Workflow
💬 0 Comments