Linux Server CPR: Performance Triage When It Hits the Fan
It's 3 AM. Your pager goes off. A production server is on fire — load average at 80, SSH responses take 15 seconds, and the users are already complaining on Slack. You've got maybe five minutes before management starts asking questions. What do you check first?
Every sysadmin has been here. Let's talk about the quickest path from "everything's broken" to "okay, I know what's wrong" — without panicking and without rebooting blind.
The 60-Second Health Check
Before you start tweaking kernel parameters, scope the damage. Fire up these three commands in sequence — they'll tell you 80% of what you need to know:
| Command | What It Reveals | Red Flag |
|---|---|---|
| `uptime` | Load average (1, 5, 15 min) | Load >> CPU core count |
| `free -h` | RAM usage + swap | Swap usage > 0 = trouble |
| `df -h` | Disk space | Any partition > 90% |
If all three look reasonable but the server is still gasping, check `dmesg | tail -20` for OOM killer messages or disk I/O errors. Nine times out of ten, one of these four things is the culprit.
The CPU Culprit
Run `top` or `htop`, hit `P` (sort by CPU), and look for the process eating cycles. Common offenders:
- Runaway cron jobs — someone scheduled a backup during peak hours. Classic.
- Database queries gone rogue — `SELECT * FROM transactions WHERE 1=1` with no LIMIT. We've all been there.
- Cryptominers — if you see a process named `httpd` or `sysupdate` using 400% CPU and you didn't deploy it, congratulations, you've been cryptojacked.
Quick fix: `kill -9` the offender, then figure out who put it there. For recurring issues, set up per-process CPU limits with `systemd` slices or `cpulimit`.
When Memory Betrays You
Memory issues are sneakier than CPU — they build up slowly until swap thrashes and the OOM killer starts playing Russian roulette with your processes.
`free -h` shows available memory, but the real story is in swap usage. If `swapon --show` reports anything above 0% after the server has been running a while, you're overcommitted.
The /proc/meminfo deep dive:
```
grep -E "^(MemTotal|MemAvailable|SwapTotal|SwapFree|Dirty|Writeback)" /proc/meminfo
```
If `Dirty` + `Writeback` is over 10% of RAM, your disk can't keep up with writes. You've got an I/O problem masquerading as a memory problem.
Quick fix: Restart the hungriest service first (usually the Java app or database). If it's chronic, add swap file or — better yet — add RAM. And please, for the love of all that is holy, stop running Chrome on production servers.
I/O: The Silent Killer
I/O waits are the most underdiagnosed performance killer in Linux. `iostat -x 1` will show you `%util` per disk. If it's consistently above 80%, your disks are the bottleneck.
Top I/O hogs to hunt:
- Log rotation gone wrong — an overzealous logrotate is trying to compress 50GB of nginx logs. Check `/var/log/` disk usage.
- Database checkpoint flushes — PostgreSQL or MySQL writing dirty buffers. Tune `checkpointcompletiontarget` (PostgreSQL) or `innodbiocapacity` (MySQL).
- Backup jobs running during business hours — rsync of a 200GB directory when users are active. Schedule this for 2 AM, not 2 PM.
Quick fix: `ionice -c 3 -p
Conclusion
Performance triage isn't about knowing every single kernel parameter — it's about having a repeatable process. Uptime → free → df → top → iostat. Five commands, sixty seconds, and you've gone from "server is broken" to "here's what's wrong and here's what to do about it."
Save the deep-dive profiling for daytime. At 3 AM, you just need answers. And coffee. Definitely coffee. ☕
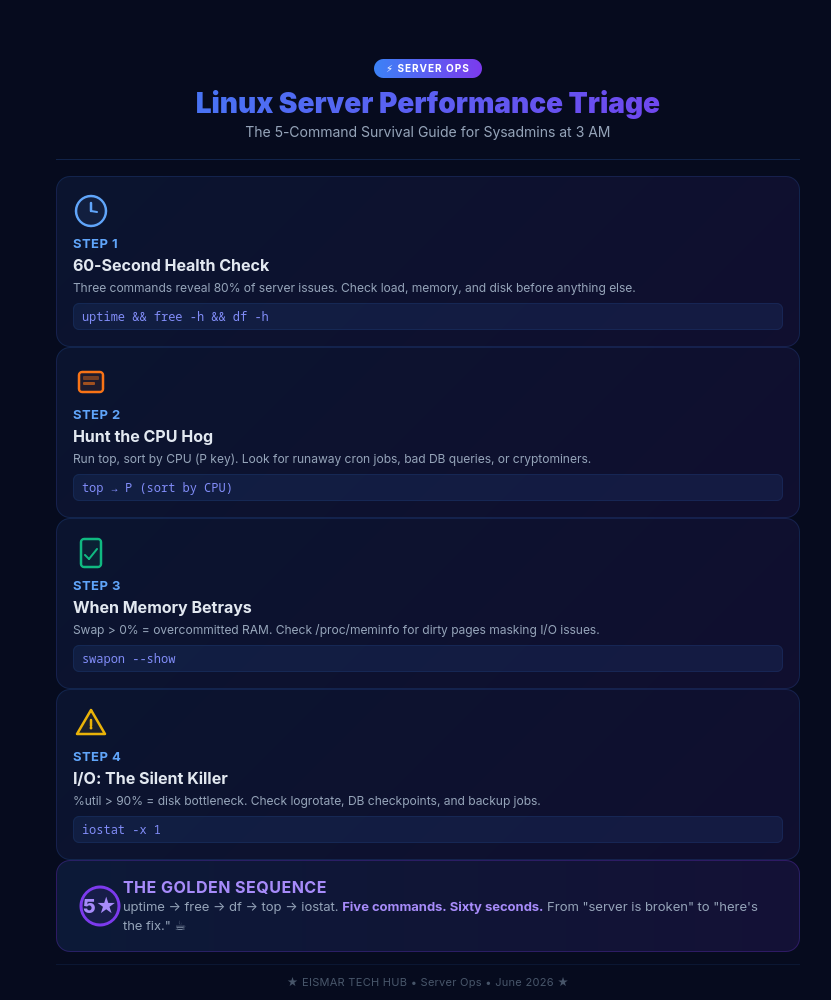
Infographic: Linux Server Performance Triage
Got a war story from your own 3 AM server rescue? Drop it in a comment — misery loves company.
💬 0 Comments